
CFD HEAT EXCHANGER STUDY
This is an example of detailed flow within a baffle type heat exchanger. CFD is a useful add on to the standard methods of rating and investigating the performance of heat exchangers. The flow can be visualized and based on this configuration, optimisations can be made maybe without the need to replace a bundle.
For the purpose of this example shell side was 24” (610 mm) with a length of 7’ (2133 mm)
This example will highlight the following areas:
Poor Distribution
Hot Spots
Erosion Concerns
Potential fouling

Shell Side Flow Distribution
This simulation shows that the heating medium is not well distributed. This will lead to localised area of effective heat transfer (shown later in more detail). There will be regions of re circulation on the downstream side of the baffles.

Heat Transfer Coefficient
This plots shows the distribution of the Heat Transfer Coefficient. It shows that regions of high transfer are below where the heating medium enters on the shell side. Down the length of the heat exchanger, the darker blue regions highlight where reduced a reduced level of heat transfer is taking place. We expect that by use of different baffling the heat exchanger efficiency can be improved.

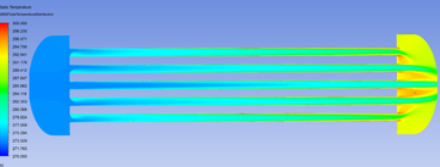
Tube Temperatures
This plot shows the distribution of the outer temperature of the tubes. As expected from the previous plots of the flow distribution and the heat transfer coefficient the temperature profile shows hot spots.
This is undesirable from a mechanical integrity view point especially when considering the degradation of mechanical strength at high temperatures and therefore the chance of tube rupture.

Tube Flow Velocity Maldistribution
The plots below shows the velocity distribution in two planes with the heat exchanger. Due to the location of the inlet of the cold fluid entry, we can see that flow is biased through the central tubes as opposed to the outer ones. In this example the velocity through the central tube is 2.5 times higher than the ones around the outside. Higher tube velocities could lead to erosion as well and have a negative impact on overall heat transfer efficiency.


Tube Flow Temperature Profiles
Due to the velocity distribution highlighted, it shows the consequence on the tube side temperature profiles are uneven.

Detailed Flow Considerations
In order to improve the accuracy of the simulations, the physical properties of the cold and warm fluids can be made to change as a function of pressure and temperature.
In the images below, we have shown the effect of the heating medium on the density and viscosity of the flows on the tube and shell sides.

